George PipisUnderstanding Getters and Setters in PythonAn introduction to getters and setters in Python·3 min read·May 2, 2024----
George PipisImage Captioning and Question Answering With HuggingFaceHow to generate image captioning with Hugging Face with few lines of code·3 min read·Mar 21, 2024----
George PipisIntro to Chatbots with HuggingFaceSee how to work with open-source LLMs and Chatbots with HuggingFace·3 min read·Mar 15, 2024----
George PipisNER with OpenAI and LangChainDid you know that you can apply NER using LangChain? See how →·3 min read·Feb 29, 2024----
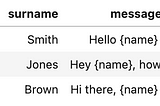
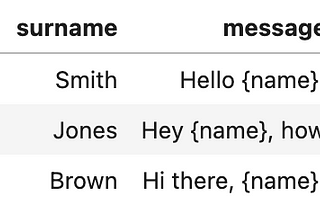
George PipisDynamic Content Generation in Pandas DataFramesHow to generate content dynamically using Pandas·2 min read·Feb 19, 2024----
George PipisGet Started with Chroma DB and Retrieval Models using LangChainA walk-through tutorial on how to use your data and ask questions using LangChain·4 min read·Feb 16, 2024----
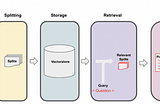
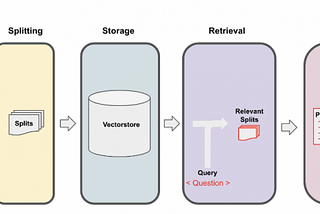
George PipisDocument Splitting with LangChainA tutorial about Document Splitting with LangChain·7 min read·Feb 13, 2024--1--1
George PipisHow to Q&A YouTube Data with LangChainDid you know that we can work with retrieval models by taking into consideration as documents the YouTube videos?·4 min read·Feb 9, 2024----
George PipisGet Started With OpenAI AssistantsA Walkthrough example of how to use the OpenAI Assistants with the Python SDK·4 min read·Jan 31, 2024----
George PipisHow to Connect Wikipedia with ChatGPT and LangChainChatGPT integration with Wikipedia using LangChain·2 min read·Aug 11, 2023----